

- Joined
- Oct 12, 2023
- Posts
- 147
- Reaction score
- 52
What prompts people to subscribe to your email newsletter? To read your articles? To purchase your product or avail of your online services? It’s your website, which elements work together. It’s necessary to understand what specifically attracts users, turning them into clients. In this matter, you shouldn’t act at random. In order to effectively optimize a website, workable ideas need to be sorted from less practical features. This is what A/B testing is for.
A/B testing, or split testing, is a user-experience research method that compares the effectiveness of two options of a digital resource. For instance, you could show two versions of the same web page to different segments of users and analyze which version leads to the best conversion rates.
A/B testing helps to:
A/B testing has lots of use cases but not suitable for all scenarios. Here’s when it won’t work:
A/B testing is a sequential process. Let’s look at its steps using the example of an A/B test scenario to optimize the ‘Subscribe’ button for an IT startup blog:
First, you need to have a clear grasp of the goals you want to achieve; whether to boost conversions, extend the time users spend on your site, or prompt specific actions, like signing up for a newsletter.
Then select an element to test. It could be a headline, a button, or a subscription form — anything that is relevant. If you test multiple elements at once, you won’t be able to determine which specific change made one result better than another.
To select an element, you need to examine the current funnel to understand where potential subscribers are lost. Once you have an assumption, you need to formulate a well-founded hypothesis.
A well-founded marketing hypothesis is a specific, testable assumption about how a particular action will affect the result of a business.
A hypothesis contains three elements:
Example
Goal: Increase the subscription conversion rate on the IT startup blog.
Subject: A ‘Subscribe’ button.
Hypothesis: Altering the “Subscribe” button’s color, copy, and placement will make it more noticeable and appealing, increasing click-through and overall subscriptions.
Metrics for A/B testing are indicators that evaluate the effectiveness of two versions of the same element. They help you understand which changes in the product have a real impact on its effectiveness, and make decisions based on data, not guesswork.
Metrics to pay attention to:
You need to choose the key metric that will show the validity of your hypothesis. If you are testing an email newsletter subscription form, for instance, this is the number of subscriptions. Once this has been identified, determine additional indicators for more detailed analysis. For a subscription form, these could be the number of forms completed, the time users spend on the form and the usefulness of fields.
To choose the right metrics, you need to:
Example
Primary metric: Percentage of users who successfully subscribe after landing on a blog post.
Secondary metrics:
Set up a control group and an experimental group to gather data on two versions of the selected element. If necessary, divide the target audience into segments according to different criteria, such as gender, age, interests, etc. It’s important for the sample audience to have the same characteristics as the users who usually interact with your site. Don’t forget to take into account the devices used. During the experiment, they should be evenly distributed between the user groups.
If you conduct research on special platforms, the system will create groups automatically. Usually, they have an equal number of users. All you need to do is set the total audience size.
Example
Audience: All users landing on any blog post.
Segments to analyze post-test:
To conduct A/B testing of a website, use specialized services that allow you to select appropriate metrics, divide traffic between the various options being tested and analyze the results. There are many such services, and the choice depends on your goals.
Google Analytics

Cost: free
The service, using the ‘Experiments’ tool, allows you to conduct standard A/B testing of website pages, distributing traffic equally between two versions of the landing page. After testing, it generates a report showing which version worked better.
Google Analytics also offers detailed analysis of user behavior on the site, generates detailed reports, can be integrated with CRM, and automatically determines which users can be the most profitable.
Optimizely
Cost: Request pricing
The service quickly conducts split testing of page elements such as headings, calls to action, images, and forms. You can also send personalized offers to different visitors depending on the pages they open or other actions they have taken.
You can create and manage experiments across all devices.
Moreover, Optimizely segments traffic by cookies, devices, geolocation, browsers and other parameters. You can also identify traffic from previously launched advertising campaigns.
VWO
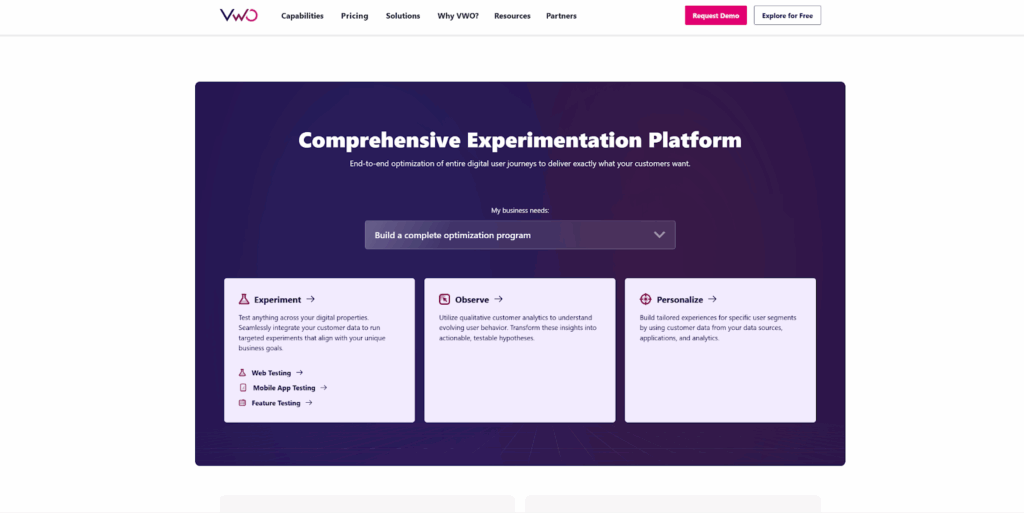
Cost: there are several plans for different purposes, and a 7-day trial period
The service helps companies understand the behavior of website visitors, create targeted campaigns and conversions, and get information about how visitors interact with web pages.
The tool optimizes conversion, collects metrics from different sources, allows you to track visitor actions and helps develop personalized content.
VWO builds reports in real time, showing what works and which changes are better to roll back.
AB Tasty
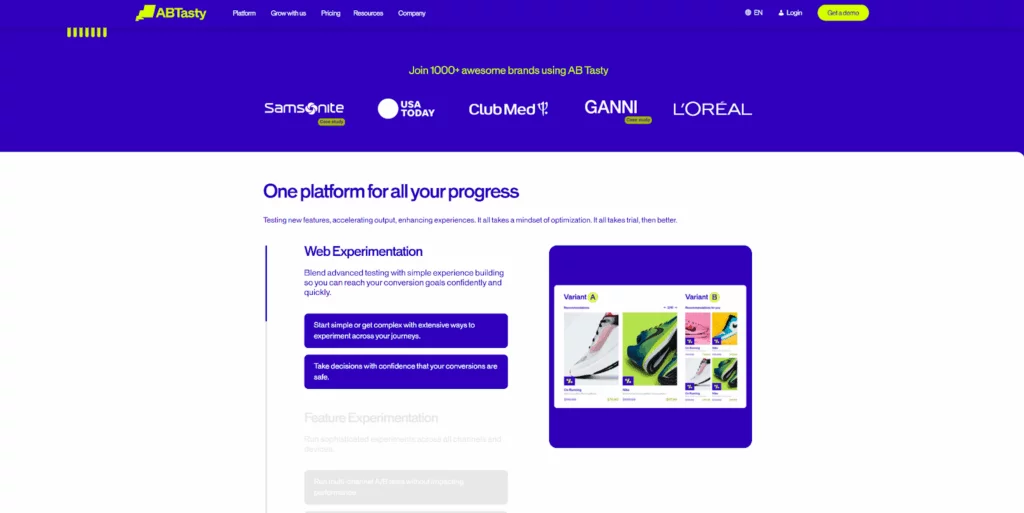
Cost: Request pricing
The service segments traffic by location, URL, devices and other parameters. You can connect your data management platform to set up fine-grained segmentation.
AB Tasty provides real-time reports, immediately showing data on specific metrics.
You have the opportunity to integrate the service with third-party platforms and CMS, including WordPress, Google Analytics, PrestaShop and Drupal.
One option is to prepare a modified version of the element and run an experiment. Testing lasts till statistical significance. To find out the optimal period for yourself, divide the total sample by daily traffic. This will give you the required number of days.
Testing is best carried out during quiet periods when there are no sales, seasonal factors or special conditions.
Whatever the results, it’s best not to end the experiment ahead of schedule. The metric may suggest the validity of the hypothesis during the initial stage, only for results to be quite different towards the end of the study.
Example
Variants:
Traffic allocation: Even split to send 50% of eligible users to each variant (A, B).
Statistical significance:
Approximate users needed per variant: ~5,000.
Duration: Until each variant reaches sample size threshold.
Along with the key metric, study additional indicators and audience behavior by segment. This approach will help you see the picture as a whole, because, even if you have confirmed the hypothesis and achieved the desired result for the main metric, other related indicators, such as time spent on the site, may have been adversely affected.
Testing can get exciting – but avoid those pitfalls:
1. Testing multiple elements at once. The main rule of A/B testing is to only test one element at a time as, otherwise, you won’t be able to understand which change will lead to the goal. If you change five elements at the same time, you won’t be able to tell what exactly affected the improvement or deterioration. You will be left guessing.
Instead of testing many elements at once, make a list of hypotheses, sort them by priority and conduct several tests. This will give you reliable results that will help optimize your site.
2. Running multiple experiments at the same time. When running multiple experiments at the same time, there is a risk that the user will see the original version of the page in one experiment, the test version in the second, and the original version in the third. Such an intersection distorts the results of the experiments and does not allow reliable conclusions to be drawn.
It’s worth adhering to the rule: ‘one experiment at a time.’ Otherwise, the audience of several simultaneous experiments will overlap with each other.
3. Testing on small traffic volumes. If the sample for the experiment is smaller, this will slow down the receipt of the data necessary for analysis. While you’re waiting, the hypothesis being tested may become irrelevant.
If you don’t have enough traffic to conduct testing, you may want to abandon the experiment or postpone it for a while.
4. Following ready-made examples. As each site is individual, so is each A/B test. They can’t be carried out using ready-made templates. Each site has its own target audience and its own experience of interacting with users. Simply copying other people’s ideas doesn’t make any sense, and sometimes even leads to counterproductive results.
Don’t look for a ready-made version of A/B testing, even if you are still a beginner. It’s better to spend more time and resources conducting a test that is relevant to your site and your audience. Avoid simply following others’ experiences. Instead, learn from them by analyzing and drawing insights. Then, form your own hypotheses and test them in practice.
A/B testing, or split testing, is a method that compares the effectiveness of two options. It helps to implement new features, improve user experience, and increase target actions. It identifies the attractive and off-putting elements of a website, and also evaluates the effectiveness of changes.
To successfully conduct A/B testing, you need to be consistent and strictly follow the steps: define the goal and the subject of the testing, formulate a hypothesis, determine key metrics, ensure sufficient traffic to obtain statistical significance, and avoid common mistakes.
The metric to be tracked depends on the goals of testing. Common choices include conversion, the bounce rate, CTR, ROI and the average check.
This is a specific, testable assumption about how a particular action will affect the business result. For instance, adding a subscription form to your blog will cause your email newsletter base to grow by 20% within a month.
Want to know more about website solutions for your business? Visit the it.com Domains blog and follow us on social media.
Continue reading at the it.com Domains blog...
What A/B Testing Is and Why You Need It
A/B testing, or split testing, is a user-experience research method that compares the effectiveness of two options of a digital resource. For instance, you could show two versions of the same web page to different segments of users and analyze which version leads to the best conversion rates.
A/B testing helps to:
- Implement new features. Before making changes to a website or another digital source, it’s wise to test them first. This helps prevent modifications that could degrade performance. By doing so, you can discern which elements on the site engage users and which drive them away. It also allows you to gauge whether the proposed changes will achieve the desired outcome.
- Improve user experience. This includes testing options for the order form, navigation, layout, and design. Tests can show which interface option is most convenient for people to interact with.
- Get more users to complete actions. Tests can indicate the text, image or design that best motivates the audience to make a purchase or leave a request.
A/B testing has lots of use cases but not suitable for all scenarios. Here’s when it won’t work:
- If you don’t have a well-founded marketing hypothesis, or in other words, no assumption about how exactly an element can be improved.
- If your site has little traffic. To get statistically significant results, you need to attract a sufficient audience for testing.
- If you need statistically significant results quickly (the statistical analysis reveals results that are highly unlikely to be random, suggesting a specific cause) and don’t have time to wait.
- If you expect the experiment’s conditions to change during its implementation. To get accurate results, you need to keep everything unchanged except for the variable you are testing.
How to Conduct A/B Testing
A/B testing is a sequential process. Let’s look at its steps using the example of an A/B test scenario to optimize the ‘Subscribe’ button for an IT startup blog:
1. Define the Goal, Select a Subject and Formulate a Hypothesis
First, you need to have a clear grasp of the goals you want to achieve; whether to boost conversions, extend the time users spend on your site, or prompt specific actions, like signing up for a newsletter.
Then select an element to test. It could be a headline, a button, or a subscription form — anything that is relevant. If you test multiple elements at once, you won’t be able to determine which specific change made one result better than another.
To select an element, you need to examine the current funnel to understand where potential subscribers are lost. Once you have an assumption, you need to formulate a well-founded hypothesis.
A well-founded marketing hypothesis is a specific, testable assumption about how a particular action will affect the result of a business.
A hypothesis contains three elements:
- A clear change. What will be done, where and how? For example, a subscription form could be added to a blog.
- An expected result. What exactly do you want to get? The result should be measurable and tied to a number, such as an increase in conversion, a decrease in cost per lead, an increase in the time users spend on the site. For example, a 20-per-cent growth in the email newsletter base within a month.
- The reasoning behind it, explaining why the change should work. In the example above, adding a form might boost the email newsletter base because it appears immediately after opening the blog page, where it attracts the attention of users and encourages them to subscribe.
Example
Goal: Increase the subscription conversion rate on the IT startup blog.
Subject: A ‘Subscribe’ button.
Hypothesis: Altering the “Subscribe” button’s color, copy, and placement will make it more noticeable and appealing, increasing click-through and overall subscriptions.
2. Choose Metrics
Metrics for A/B testing are indicators that evaluate the effectiveness of two versions of the same element. They help you understand which changes in the product have a real impact on its effectiveness, and make decisions based on data, not guesswork.
Metrics to pay attention to:
- Conversion is the ratio of the number of site visitors who perform any target actions (such as purchase, registration, subscription, visiting a specific page of the site, or clicking on an advertising link) compared to the total number of visitors, expressed as a percentage.
- Bounce Rate is the percentage of visitors who leave the site after viewing one page.
- Average Time on Page is an indicator that reflects how much time, on average, users spend on the site, interacting with its content.
- CTR (Click-Through Rate) is a metric that shows how effectively an advertising or information block works, and is measured as the ratio of the number of clicks to the number of impressions.
- Average Order Value (for online stores) is the average amount that a buyer spends during one visit. To calculate it, you need to divide the value of total sales for a specific period by the number of buyers. The formula is: AOV = Revenue / Conversions.
- Scroll Depth is a metric that measures how far a user scrolls on a page during a visit. It is expressed as a percentage, and helps to understand how much content users consume before leaving the page.
You need to choose the key metric that will show the validity of your hypothesis. If you are testing an email newsletter subscription form, for instance, this is the number of subscriptions. Once this has been identified, determine additional indicators for more detailed analysis. For a subscription form, these could be the number of forms completed, the time users spend on the form and the usefulness of fields.
To choose the right metrics, you need to:
- Consider your business goals. Determine what you need to achieve through testing which indicators will accurately report whether the goal has been achieved. For instance, if the goal is to increase conversion, the main metric will be the number of actions performed (such as purchases or subscriptions to the newsletter).
- Consider context. Changes to a page can only impact results in specific situations. For instance, changing the color of a ‘Buy’ button may not significantly increase sales, but changing the text on a page can significantly impact conversions.
Example
Primary metric: Percentage of users who successfully subscribe after landing on a blog post.
Secondary metrics:
- CTR on the ‘Subscribe’ button.
- Scroll Depth (proxy for engagement)
- Bounce Rate from the blog post page.
3. Create an Audience
Set up a control group and an experimental group to gather data on two versions of the selected element. If necessary, divide the target audience into segments according to different criteria, such as gender, age, interests, etc. It’s important for the sample audience to have the same characteristics as the users who usually interact with your site. Don’t forget to take into account the devices used. During the experiment, they should be evenly distributed between the user groups.
If you conduct research on special platforms, the system will create groups automatically. Usually, they have an equal number of users. All you need to do is set the total audience size.
Example
Audience: All users landing on any blog post.
Segments to analyze post-test:
- New vs. Returning Visitors (returning users may be more trustful or ready to subscribe).
- Device Type (mobile vs. desktop, to assess how button visibility/placement affects behavior).
- Traffic Source (organic (SEO), paid (ads), direct, and social to understand context-driven performance).
4. Choose Tools
To conduct A/B testing of a website, use specialized services that allow you to select appropriate metrics, divide traffic between the various options being tested and analyze the results. There are many such services, and the choice depends on your goals.
Google Analytics

Cost: free
The service, using the ‘Experiments’ tool, allows you to conduct standard A/B testing of website pages, distributing traffic equally between two versions of the landing page. After testing, it generates a report showing which version worked better.
Google Analytics also offers detailed analysis of user behavior on the site, generates detailed reports, can be integrated with CRM, and automatically determines which users can be the most profitable.
Optimizely
Cost: Request pricing
The service quickly conducts split testing of page elements such as headings, calls to action, images, and forms. You can also send personalized offers to different visitors depending on the pages they open or other actions they have taken.
You can create and manage experiments across all devices.
Moreover, Optimizely segments traffic by cookies, devices, geolocation, browsers and other parameters. You can also identify traffic from previously launched advertising campaigns.
VWO

Cost: there are several plans for different purposes, and a 7-day trial period
The service helps companies understand the behavior of website visitors, create targeted campaigns and conversions, and get information about how visitors interact with web pages.
The tool optimizes conversion, collects metrics from different sources, allows you to track visitor actions and helps develop personalized content.
VWO builds reports in real time, showing what works and which changes are better to roll back.
AB Tasty

Cost: Request pricing
The service segments traffic by location, URL, devices and other parameters. You can connect your data management platform to set up fine-grained segmentation.
AB Tasty provides real-time reports, immediately showing data on specific metrics.
You have the opportunity to integrate the service with third-party platforms and CMS, including WordPress, Google Analytics, PrestaShop and Drupal.
5. Conduct an Experiment
One option is to prepare a modified version of the element and run an experiment. Testing lasts till statistical significance. To find out the optimal period for yourself, divide the total sample by daily traffic. This will give you the required number of days.
Testing is best carried out during quiet periods when there are no sales, seasonal factors or special conditions.
Whatever the results, it’s best not to end the experiment ahead of schedule. The metric may suggest the validity of the hypothesis during the initial stage, only for results to be quite different towards the end of the study.
Example
Variants:
| Variant | Button Color | Button Text | Placement |
| Control (A) | #CCCCCC (neutral grey) | ‘Subscribe’ | Bottom of blog post |
| Variant (B) | #007BFF (vivid blue) | ‘Get Tech Insights Weekly’ | Top & bottom of blog post (dual placement) |
Traffic allocation: Even split to send 50% of eligible users to each variant (A, B).
Statistical significance:
- Current conversion 2%.
- Detectable lift +25%.
Approximate users needed per variant: ~5,000.
Duration: Until each variant reaches sample size threshold.
6. Analyze the Results
Along with the key metric, study additional indicators and audience behavior by segment. This approach will help you see the picture as a whole, because, even if you have confirmed the hypothesis and achieved the desired result for the main metric, other related indicators, such as time spent on the site, may have been adversely affected.
Typical mistakes in A/B testing
Testing can get exciting – but avoid those pitfalls:
1. Testing multiple elements at once. The main rule of A/B testing is to only test one element at a time as, otherwise, you won’t be able to understand which change will lead to the goal. If you change five elements at the same time, you won’t be able to tell what exactly affected the improvement or deterioration. You will be left guessing.
Instead of testing many elements at once, make a list of hypotheses, sort them by priority and conduct several tests. This will give you reliable results that will help optimize your site.
2. Running multiple experiments at the same time. When running multiple experiments at the same time, there is a risk that the user will see the original version of the page in one experiment, the test version in the second, and the original version in the third. Such an intersection distorts the results of the experiments and does not allow reliable conclusions to be drawn.
It’s worth adhering to the rule: ‘one experiment at a time.’ Otherwise, the audience of several simultaneous experiments will overlap with each other.
3. Testing on small traffic volumes. If the sample for the experiment is smaller, this will slow down the receipt of the data necessary for analysis. While you’re waiting, the hypothesis being tested may become irrelevant.
If you don’t have enough traffic to conduct testing, you may want to abandon the experiment or postpone it for a while.
4. Following ready-made examples. As each site is individual, so is each A/B test. They can’t be carried out using ready-made templates. Each site has its own target audience and its own experience of interacting with users. Simply copying other people’s ideas doesn’t make any sense, and sometimes even leads to counterproductive results.
Don’t look for a ready-made version of A/B testing, even if you are still a beginner. It’s better to spend more time and resources conducting a test that is relevant to your site and your audience. Avoid simply following others’ experiences. Instead, learn from them by analyzing and drawing insights. Then, form your own hypotheses and test them in practice.
FAQs
What is A/B testing and why is it important?
A/B testing, or split testing, is a method that compares the effectiveness of two options. It helps to implement new features, improve user experience, and increase target actions. It identifies the attractive and off-putting elements of a website, and also evaluates the effectiveness of changes.
How can I successfully conduct A/B testing?
To successfully conduct A/B testing, you need to be consistent and strictly follow the steps: define the goal and the subject of the testing, formulate a hypothesis, determine key metrics, ensure sufficient traffic to obtain statistical significance, and avoid common mistakes.
What metrics should be tracked during A/B testing?
The metric to be tracked depends on the goals of testing. Common choices include conversion, the bounce rate, CTR, ROI and the average check.
What is a well-founded marketing hypothesis?
This is a specific, testable assumption about how a particular action will affect the business result. For instance, adding a subscription form to your blog will cause your email newsletter base to grow by 20% within a month.
Want to know more about website solutions for your business? Visit the it.com Domains blog and follow us on social media.
Continue reading at the it.com Domains blog...